2026 Economic Outlook
Mar 26
8 mins

Turning to the economic landscape and financial market sentiment for 2026, we see a tenuous environment of stability that existed even before February 28th’s developments. Having recently watched a significant amount of Winter Olympic sports, we find a natural ice rink to be a helpful metaphor. The ice is surprisingly smooth, but it remains thin with visible cracks around the edges that could cause notable disruption for a variety of reasons.
The U.S. Economy: GDP Growth, AI Productivity, and the K-Shaped Economy
Last year, many economists lowered their expectations for U.S. economic growth during the initial phase of tariffs; however, many firms appeared able to offset the drop in trade by increasing AI-driven productivity and technological efficiency. Consequently, we ended 2025 with GDP growth of 2.1% per the IMF.
Looking forward, we expect growth to remain stable, with most estimates hovering between 2% and 2.5% GDP growth; however, we do think growth will be fragmented, with some areas of the market seeing higher rates of growth than others due to continued capital expenditures and infrastructure investment, notably in infrastructure development to support advancements in artificial intelligence (AI). It’s also worth noting that growth could be revised downward due to the ongoing conflict in the Middle East, though it is too early to tell by how much.
A common theme emerging this year is the K-shaped economy, in which individuals and corporations poised to take advantage of technological innovation and AI adoption will see their economic positions improve, while those disadvantaged will see their positions continue to decline. The most common differentiators between these two groups — both at the consumer and corporate levels — are access to capital and equity markets and the ability to leverage AI productivity tools.
Capital markets will likely continue to outpace wage gains. Similarly, those positioned to integrate AI into business operations and workforce productivity will thrive, while those facing pricing pressures but unable to cut costs may find themselves falling behind. The gap between capital returns and wage income continues to widen, and expectations are that this will deepen further due to AI, though the extent remains unclear.
The U.S. Stock Market Outlook: Concentration Risk and Valuation Levels
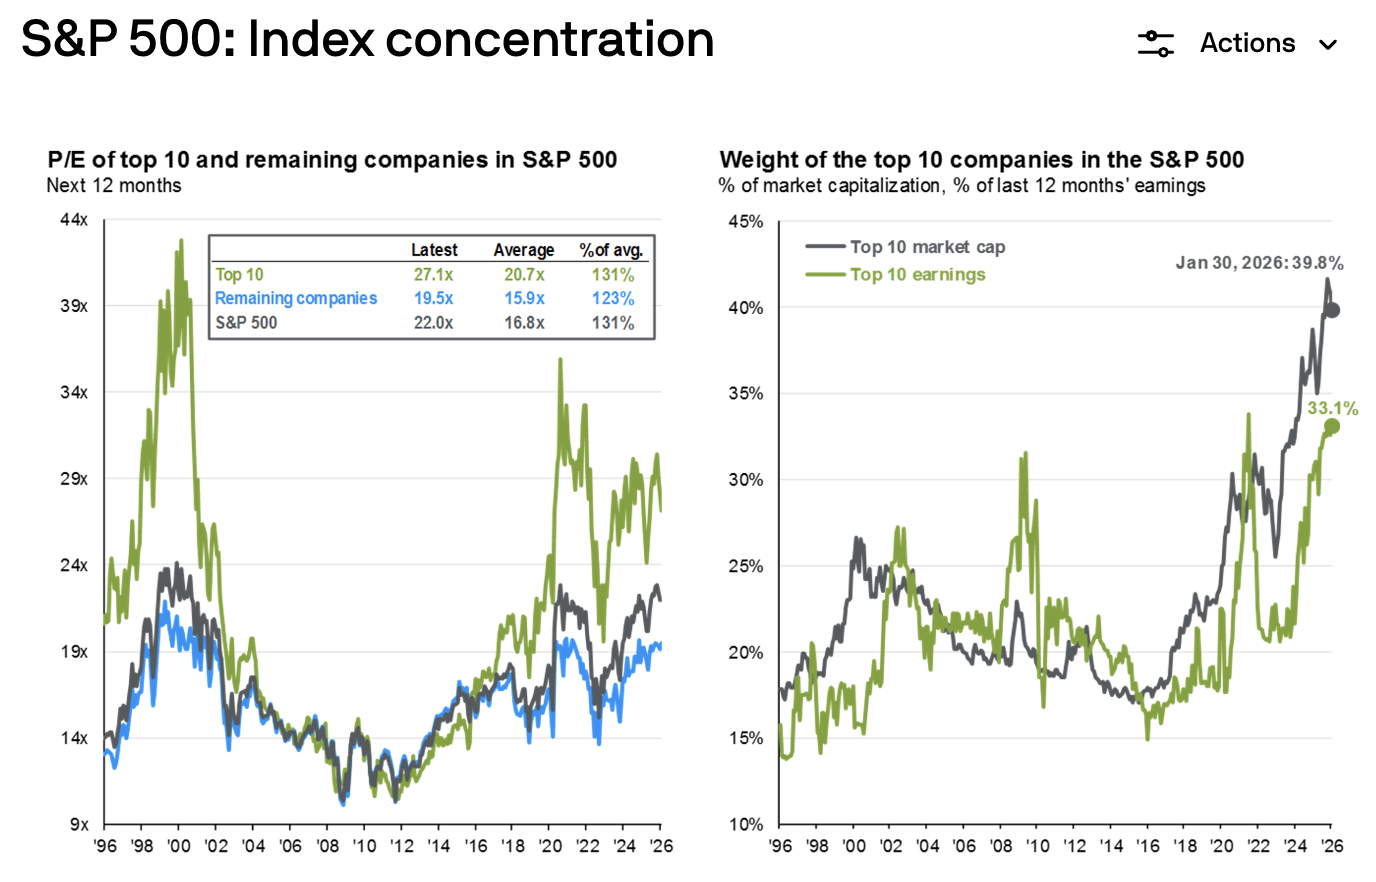
Turning to financial markets, we initially viewed our equity market outlook much like the one we faced last year, albeit more expensive and still highly concentrated. The top 10 companies in the S&P 500 now make up nearly 40% of the market cap of the total index.
They also have higher P/Es, with the top 10 companies exhibiting current price-to-earnings (P/E) ratios of roughly 27.1x, compared with the 19.5x exhibited by the rest of the index. It’s worth noting that they are also significantly outpacing the rest of the index on earnings, with the top decile accounting for 33% of S&P earnings; however, there remains some uncertainty about whether those earnings are sustainable and justify the notably higher price ratios.
Looking at equity markets in the short term, we’ve seen significant volatility amid the energy crisis stemming from limited access to the Strait of Hormuz. Most major indices are largely flat or negative year-to-date as markets weigh the long-term implications of rising crude oil prices as well as disruptions to trade. We anticipate having greater clarity on where markets are headed when the direction and timeline of the war become clearer. Until then, we expect volatility to continue.
Fiscal and Monetary Influences
One of the major sources of uncertainty continuing to rile the markets is the future of the Federal Reserve. While analysts expect the Supreme Court to uphold Jerome Powell’s position — effectively signaling their support for an independent Fed - this would also clear the path for the nomination of President Trump’s next pick for Fed Chair, Kevin Warsh. A streamlined path to a new Fed chair also offers a clearer view of rate-cutting expectations, with most economists expecting two 0.25% cuts in 2026, though we could see those cuts shrink to one or disappear altogether if inflation begins to creep upward, again as a result of rising energy prices and trade disruption.
Turning to fiscal influences, the market has priced in an uptick in economic activity this year as consumers spend the tax refunds enabled by the OBBBA tax bill passed last summer. This short-term benefit, however, is overshadowed by ongoing concerns about the rising fiscal deficit and the potential for a decline in global demand for U.S. debt. At present, financing costs for the U.S. deficit outpace defense spending, and a rising rate environment could exacerbate that cost. At the same time, a weakening dollar may help offset declining demand for U.S. debt as foreign purchasing power relative to the U.S. strengthens. Only time will tell, but we believe the deficit will continue to weigh on long-term outlooks.

International Markets: Global Growth Opportunities and Risks
Looking at international markets and global economic growth, we saw significant outperformance last year, with 2025 returns in developed international markets exceeding 30%.
A big part of this was a shift in global fiscal policy, with countries that had historically implemented austerity measures moving to more accommodating policies in the face of tariff pressures. As this activity continues, we see pockets of opportunity, where active global investing driven by strong economic fundamentals has the potential to generate additional returns.
In this too, growth is likely to be fragmented, with some countries — both developed markets and emerging markets — being better positioned than others to capitalize on the current economic environment, though those markets have also been riled by the conflict in the Middle East
Fixed Income Outlook: Bonds, Interest Rates, and Cash Positioning
Bond markets and fixed-income investments are well positioned to take advantage of lower rates, which, in a vacuum, will push up prices on existing debt.
Again, certain market segments are better positioned for growth than others. Notably, healthy areas of the lending market, where borrowers' positions are secured by physical assets (e.g., borrowers who own their homes or companies with strong balance sheets), are positioned to do well in the current environment.
It is worth noting that as rates fall, we’re seeing lower returns on short-term instruments such as money market funds, and now may be the time to consider moving cash off the sidelines and into longer-term investments.
Investment Implications: Portfolio Diversification in an Uncertain Market
As we consider the implications for our portfolios and, ultimately, our clients’ livelihoods, we turn to the measured approach of long-term financial planning and defensive investing strategies. Portfolio diversification across geographies, asset classes, and market segments should enable our clients to benefit from the upside of markets poised for growth while mitigating some of the volatility arising from ongoing uncertainty.
As always, if you have additional questions or would like to discuss specific investing concerns, we’d be happy to sit down with you and dive in a little deeper.
International Monetary Fund. “World Economic Outlook (October 2025): Real GDP Growth.” IMF DataMapper. Accessed February 24, 2026. https://www.imf.org/external/datamapper/NGDP_RPCH@WEO/OEMDC/ADVEC/WEOWORLD/USA.
J.P. Morgan Asset Management. “Guide to the Markets.” Accessed February 24, 2026. https://am.jpmorgan.com/us/en/asset-management/adv/insights/market-insights/guide-to-the-markets/.[am.jpmorgan.com]


Hannah Boundy, CFA®, CFP®
Founding/Managing Partner
With a background in both investing and operations, Hannah co-manages Sherwood's portfolios with Matthew Davis. She works with the rest of the team to align clients' investments with the rest of their legacy plan. She also runs Sherwood's back office, ensuring the entire team has everything they need to serve our clients well.
LinkedIn
*Sherwood Financial Partners, LLC (“Sherwood”) is a registered investment adviser located in Westlake Village, California. Sherwood may only transact business in those states in which it is registered, notice filed, or qualifies for an exemption or exclusion from registration requirements. Information presented is for educational purposes only and does not intend to make an offer or solicitation for the sale or purchase of any specific securities, investments, or investment strategies. Investments involve risk and, unless otherwise stated, are not guaranteed. The information contained herein is not intended to convey or constitute legal or tax advice. Be sure to first consult with a qualified financial adviser, legal professional, and/or tax professional before implementing any strategy discussed herein. Past performance is not indicative of future performance. Principal value and investment return will fluctuate. There are no implied guarantees or assurances that the target returns will be achieved or objectives will be met. Future returns may differ significantly from past returns due to many different factors. Investments involve risk and the possibility of loss of principal.
*Sherwood may discuss and display charts, graphs, and formulas; these are not intended to be used by themselves to determine which securities to buy or sell or when to buy or sell them. Such charts, graphs, and formulas offer limited information and should not be used on their own to make investment decisions.
*Sherwood may discuss and display charts, graphs, and formulas; these are not intended to be used by themselves to determine which securities to buy or sell or when to buy or sell them. Such charts, graphs, and formulas offer limited information and should not be used on their own to make investment decisions.